
If someone asks “what do you do”? You can show them a ‘knowledge graph’ of your practice environment.
Knowledge graphs
Knowledge graphs (graphs) are a visual representation of people and concepts in your practice environment.
More importantly, graphs display the relationship between them. The term ‘knowledge graph’ was coined by Google (Ehrlinger & Wöß 2016). We use the Google term because it has gained widespread acceptance other than the previous ‘node to arc graph’.
Graphs are a ‘snapshot’ of human reality which enables nurses to map out concrete and abstract concepts in their environment. For example, people, documentation and computers are concrete concepts.
Abstract concepts may be processes, ‘nursing care’, ‘bullying’, ‘checking DDs’ or ‘patient education’.
Knowledge graphs are a ‘spin-off’ of nurse Artificial Intelligence (AI) research here in Australia (Shields 2018). Graphs were originally (and still are) used to teach AI about the clinical nursing environment. It occurred to us that nurses could construct their own graphs and cut out the ‘middle person’.
A graph of your practice environment is useful for:
- Persistent organisational memory: Knowledge graphs are consumable knowledge which can be stored, this means, processes are not lost if a key member leaves the organisation
- Process modulation: Knowledge graphs may be used to add, or delete redundant processes, thus improving patient outcomes and productivity
- Evidence: Knowledge graphs may be useful as evidence to show managers where resources/money could be better placed
- Knowledge graphs are machine readable which means they may be a step toward automating the accreditation process
- A display to inform nursing students (and others) what a particular nurse actually does during a shift.
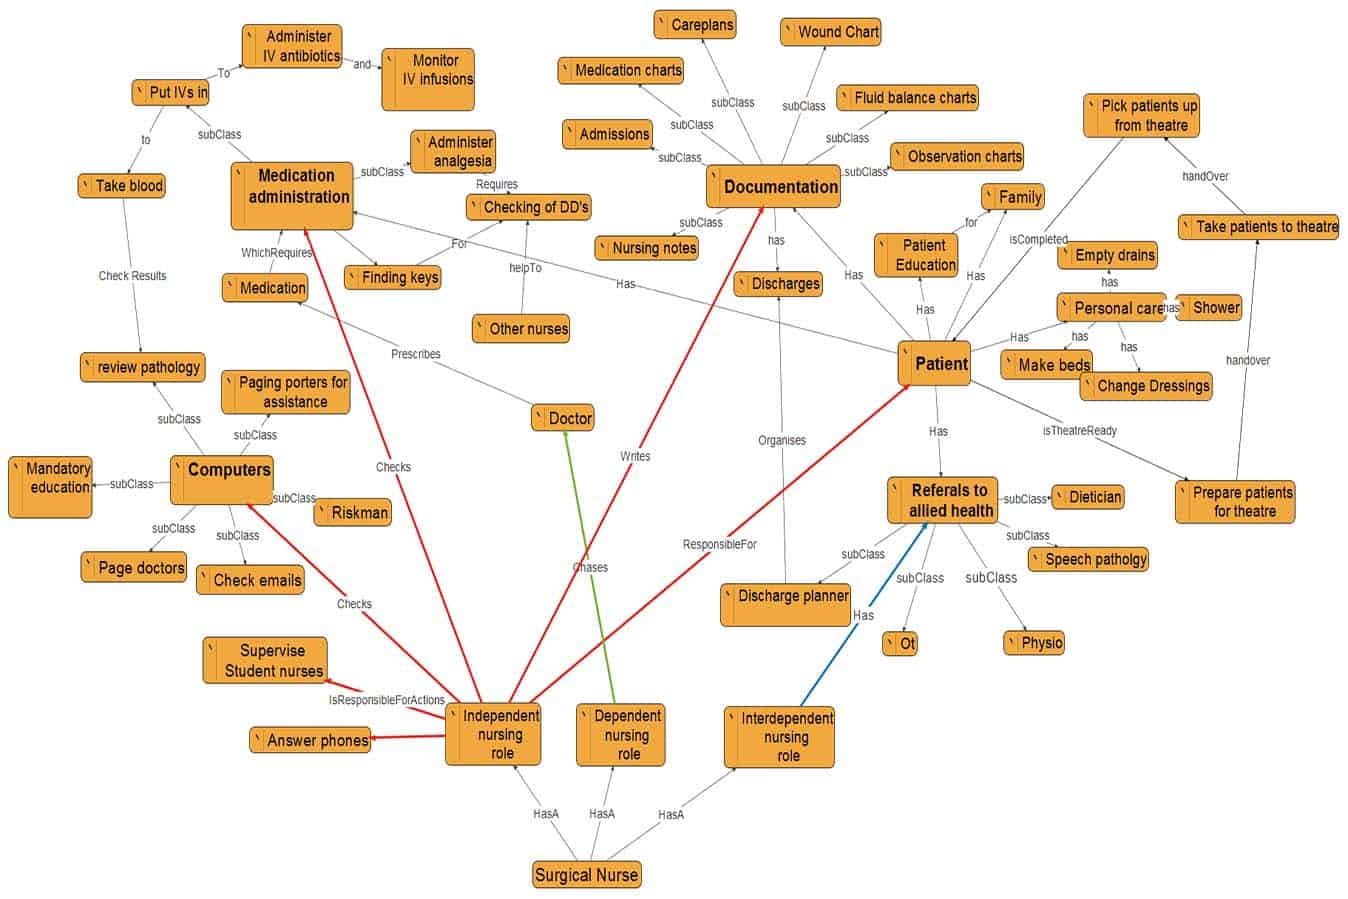
Figure 1 is a graph constructed by a surgical nurse.
The yellow boxes are called nodes (concrete and abstract concepts) and the lines (arcs) detail a labelled relationship. Two nodes connected by and arc may represent a relationship or a process. We found that nodes tend to form clusters as can be seen in Figure 1’s computer and documentation cluster. Clusters occur in ‘real life’, because ultimately, a graph is a ‘snapshot’ of human reality.
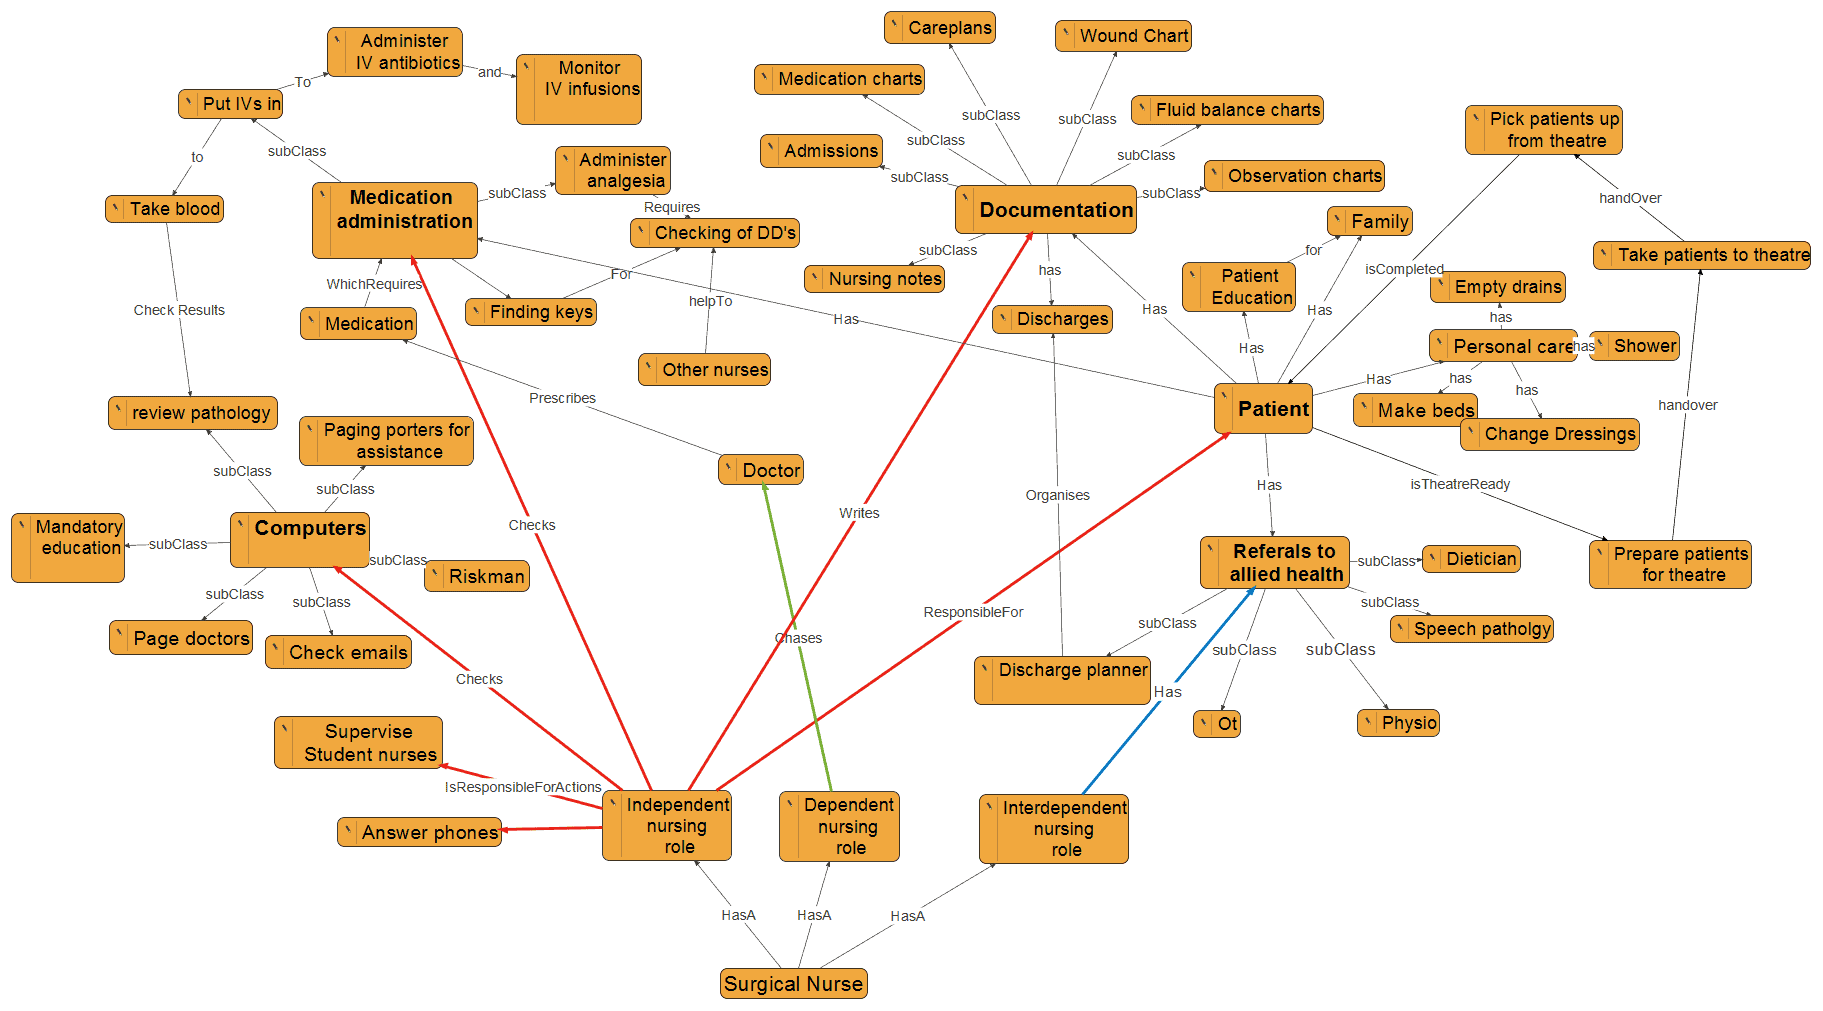
Figure 1: Surgical nurse graph
The nurse participant had no experience of graphs prior to drawing this one. She was asked to visualise herself in her environment and think about the relationships between her and people/things.
At the bottom of the graph, relationships are split into three abstract categories (Doran, Sidani, Keatings, & Doidge 2002). They are:
- Independent nursing role: Things nurses do without recourse to other people
- Dependent nursing role: Things nurses do with the recourse to a doctor
- Interdependent nursing role: Things nurses do with recourse to other disciplines such as allied health.
We asked the participant to categorise her relationships along these lines. You can see that it is a remarkably detailed graph of her practice environment; which goes to show, a graph can become complex very fast.
You can construct your own graph with a pencil and paper but Tufts University provide a free easy to use Windows program called Visual Understanding Environment (VUE) (Tufts 2016).
Draw the graph a little at a time; leave it and come back, adding things as they come to mind. You may be surprised how your environment turns out!
Graphs are subjective; our future project will be to construct a ‘group graph’. We will recruit nurses who do the same job in one practice environment. Each nurse will draw a graph and we will compare them to see commonalities and differences.
References
Doran, D., Sidani, S., Keatings, M., & Doidge, D. 2002. An empirical test of the Nursing Role Effectiveness Model. Journal of Advanced Nursing, 38, 29–39.
Ehrlinger, L., & Wöß, W. 2016. Towards a Definition of Knowledge Graphs. SEMANTiCS (Posters, Demos, SuCCESS), 48.
Shields.P. 2018. Capturing and evaluating process semantics from front-line nurses: A pilot study. Online Journal of Nursing Informatics (OJNI), 22.
Tufts. 2016. VUE. Retrieved June 20, 2019, from Visual Understanding Environment website: https://sourceforge.net/projects/tuftsvue/
Author
Dr Philip Shields RN PhD is an early career independent researcher with an interest in nursing informatics. Philip completed his PhD with Victoria University at the Western Centre for Health, Research and Education, Melbourne Australia.
To find out more about Philip’s workshops contact him at: philip.shields@live.vu.edu.au>